Prometheus integration in Federal Frontier Kubernetes Platform (FKP)
How to enable Prometheus on Frontier managed workload clusters
Prerequisites
To enable Prometheus on workload cluster you will need to enable Linkerd and Linkerd Multi-cluster of your workload cluster.
Introduction
Prometheus is an open-source monitoring and alerting toolkit designed for gathering and analyzing metrics from systems, services, and applications. It is widely used in modern cloud-native environments to monitor the performance and health of applications and infrastructure components.
Prometheus offers a comprehensive set of features and functionalities:
-
Data Collection: Prometheus collects metrics from various sources, including applications, services, and system components. It supports multiple data formats and protocols, making it versatile for monitoring diverse environments.
-
Multi-dimensional Data Model: Prometheus uses a multi-dimensional data model with key-value pairs called labels. This allows users to add context and dimensions to metrics, making it easy to filter and aggregate data for analysis.
-
Powerful Query Language (PromQL): PromQL is a query language specifically designed for working with time-series data. It enables users to perform complex queries, aggregations, and calculations on collected metrics, providing valuable insights into system behavior.
-
Scalability: Prometheus is designed to scale horizontally, allowing it to handle large volumes of metrics and high-frequency data collection. It can be used in single-server setups or distributed environments.
-
Alerting: Prometheus includes a built-in alerting system that allows users to define and configure alert rules based on metric thresholds and conditions. When alerts are triggered, Prometheus can notify operators via various notification channels.
-
Data Retention and Storage: Prometheus stores time-series data locally in a highly efficient and compressed format. Users can configure data retention policies to control how long data is retained. For longer-term storage, Prometheus can be integrated with other systems like long-term storage solutions or remote storage backends.
-
Dynamic Service Discovery: Prometheus supports dynamic service discovery, making it easy to monitor services in dynamic environments like Kubernetes clusters. It can automatically discover and scrape metrics from new service instances as they come online.
-
Rich Ecosystem: Prometheus has a thriving ecosystem of exporters, which are small agents that collect and expose metrics for various software and services. It also integrates seamlessly with Grafana, an open-source visualization and dashboarding tool, for creating custom monitoring dashboards.
A feature offered by Federal Frontier Kubernetes Platform (FKP) is automated prometheus federation. This enables you to view metrics across all your workload clusters.
Enabling Prometheus
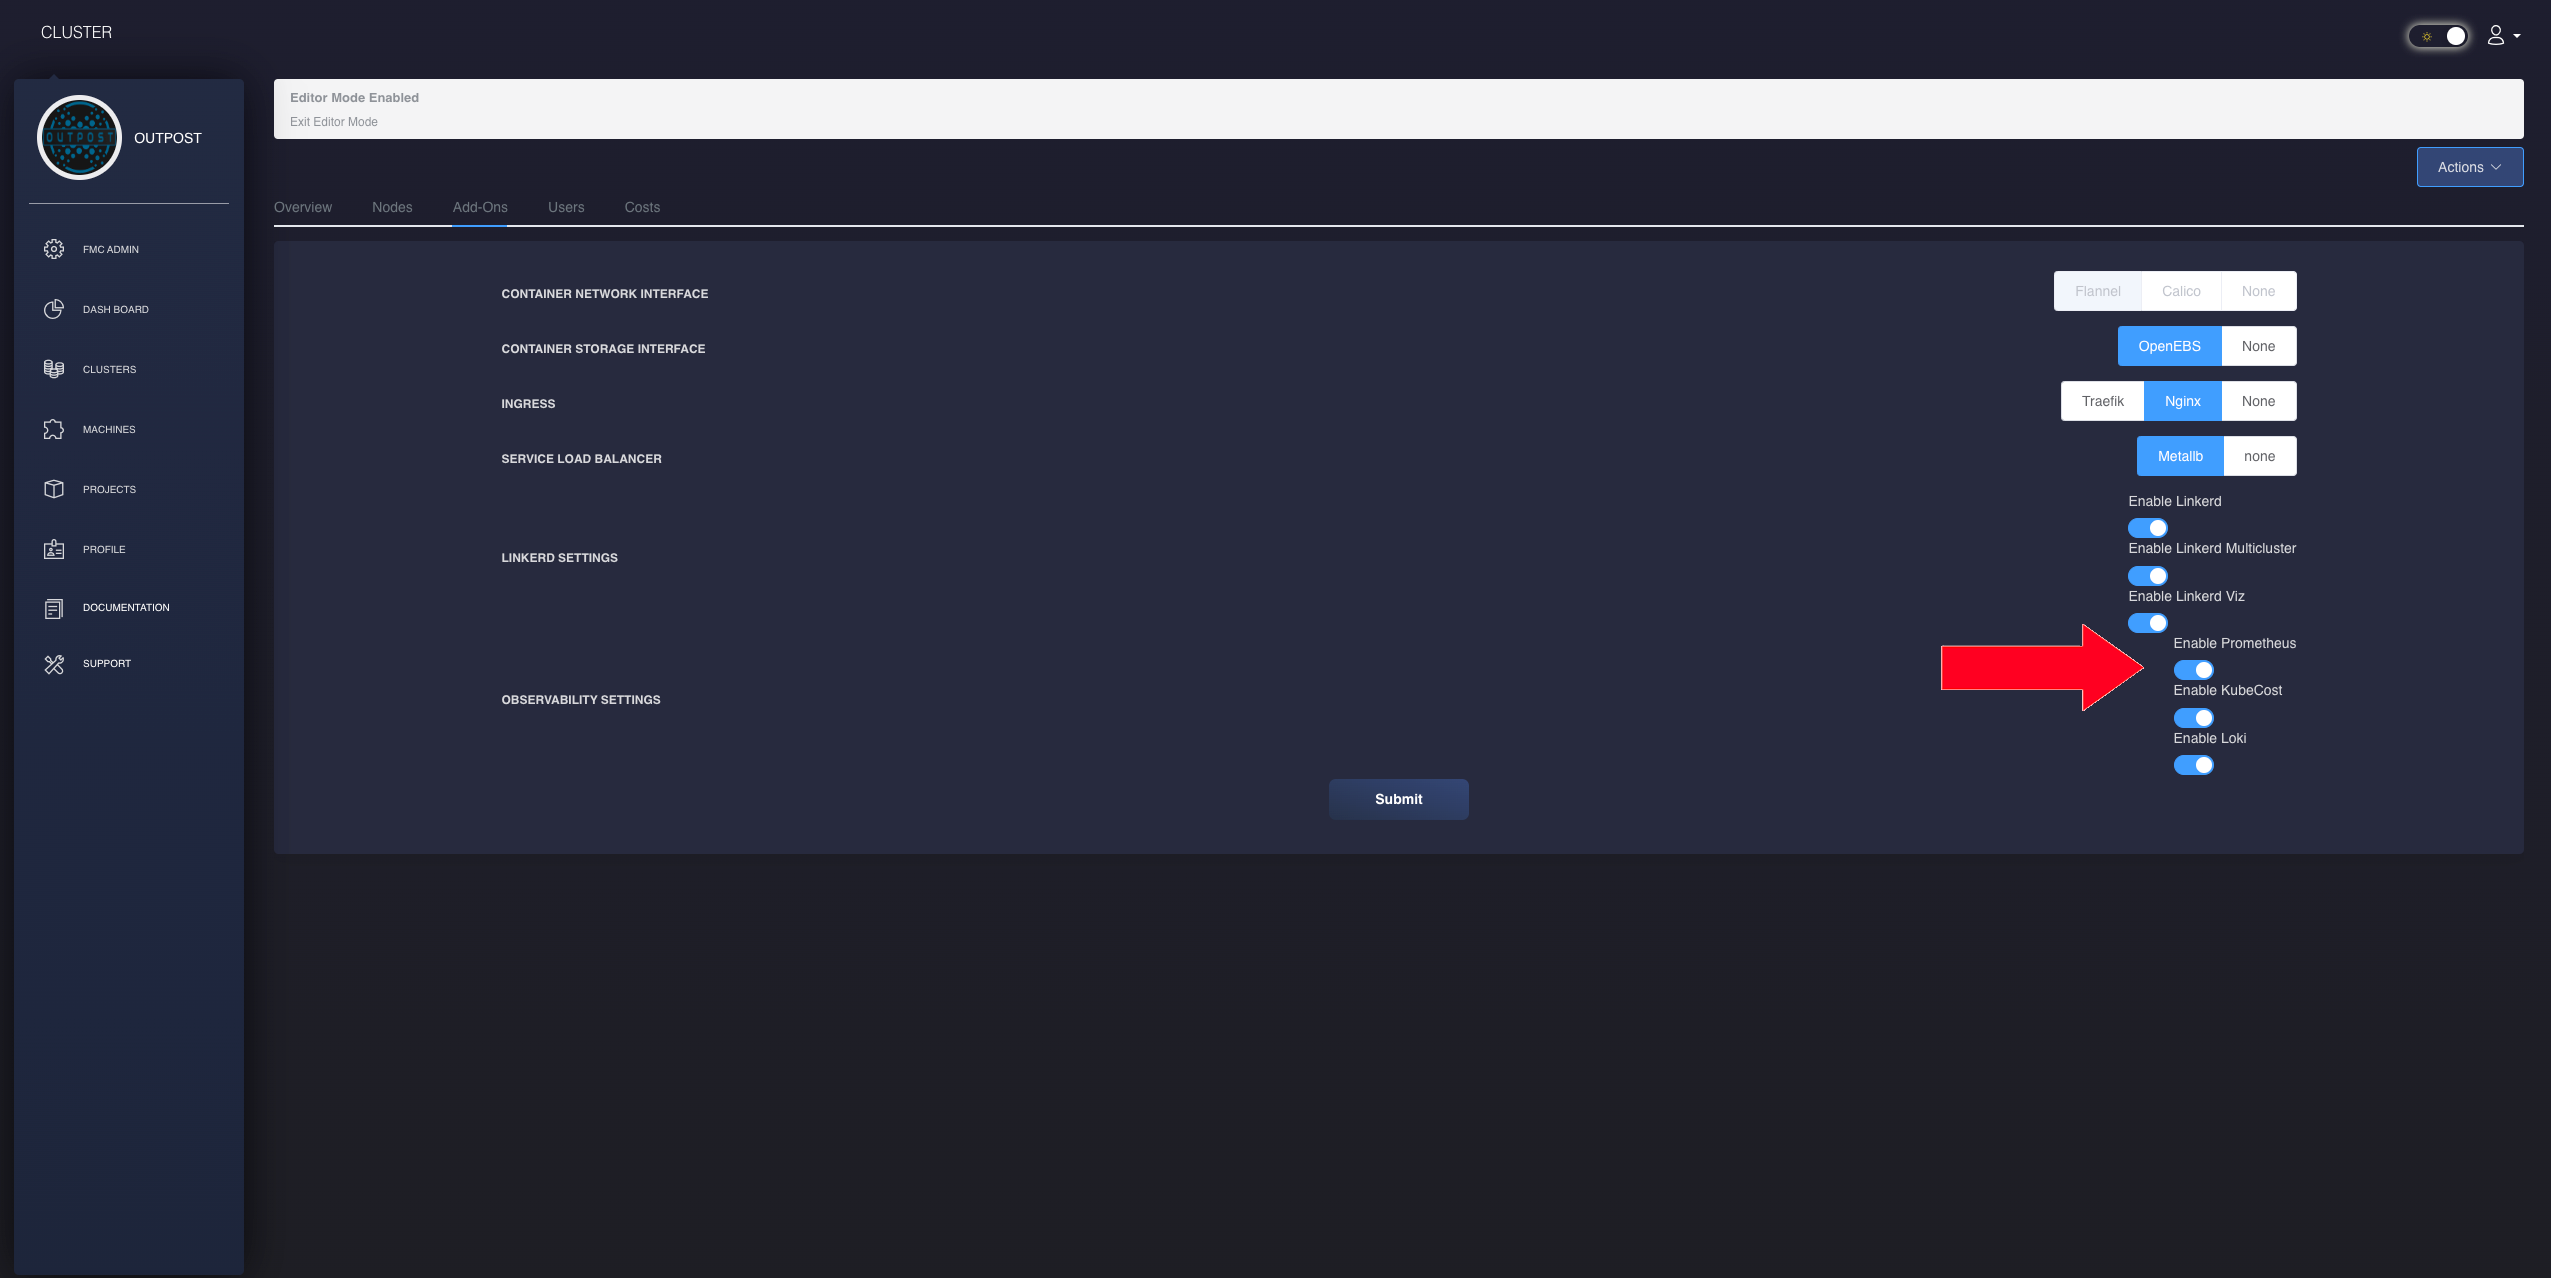
To enable prometheus in your workload cluster, simply navigate to your cluster addons and enable prometheus. Once enabled FMC will automatically configure your prometheus installation. After that, once prometheus is up and running you will be able to see metrics coming from your workload cluster in Grafana. You will be able to filter using the “cluster” and “project” labels.