Centralized Logging and Alerts for XtremeCloud Cloud-Native Applications
Multi-Cloud Logging and Alerts in a Single Plane of Glass
Introduction
We stream the logs of XtremeCloud applications from multiple clouds with LogDNA to a LogDNA account, which is a hosted, cloud logging service.
We recommend the use of LogDNA to centralize logs, analyze logs, and create alerts from any container-based application in multi-cloud Kubernetes clusters.
Although you can work with the source code of LogDNA, it is as simple as running two ‘kubectl’ commands and your logs will get streamed to the LogDNA SaaS.
You can cut to the chase and go straight to Kubernetes Logging.
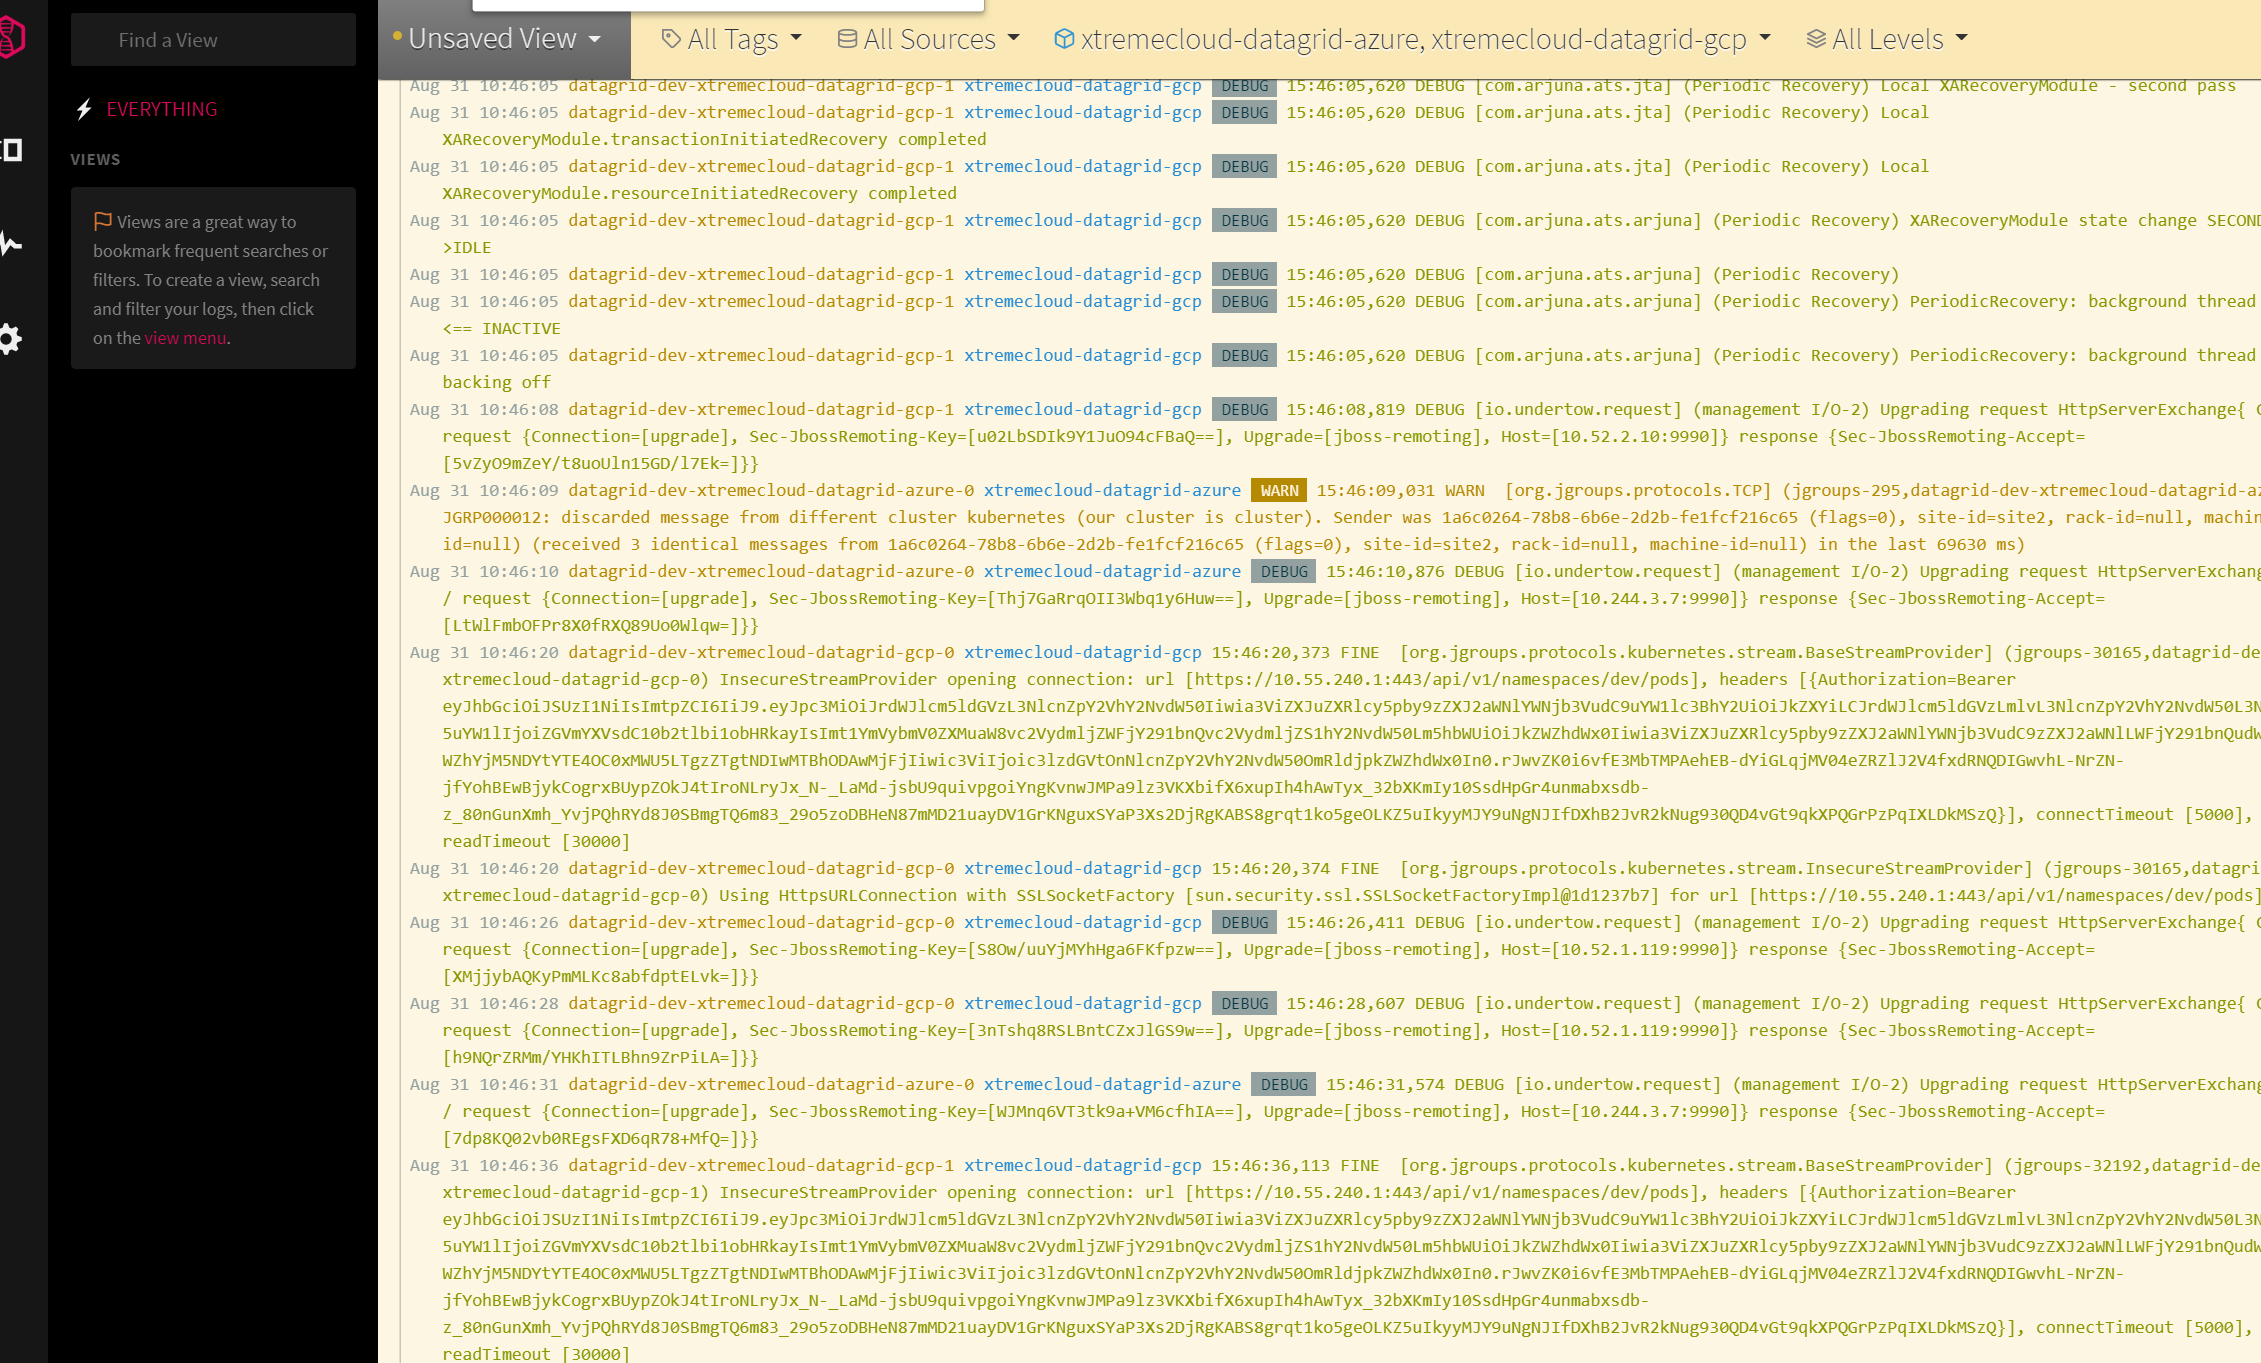
Here is a view of some of our XtremeCloud Data Grid logs from Google Cloud and Microsoft Azure in the LogDNA SaaS.
Getting Started
From an Official Release
Check out the official LogDNA site to learn how to sign up for an account and get started.
From Source
Follow these instructions to run the LogDNA agent from source:
git clone https://github.com/logdna/logdna-agent.git
cd logdna-agent
npm install

# help
sudo node index.js --help

# configure
sudo node index.js -k <YOUR LOGDNA INGESTION KEY>
# On Linux, this will generate a config file at: /etc/logdna.conf
# On Windows, this will generate a config file at: C:\ProgramData\logdna\logdna.conf

# on Linux, /var/log is monitored/added by default (recursively). You can optionally specify more folders
# on Windows, C:\ProgramData\logs is monitored/added by default (recursively). You can optionally specify more folders
sudo node index.js -d /path/to/log/folders -d /path/to/2nd/folder
sudo node index.js -d /var/log                            # folder only assumes *.log + extensionless files
sudo node index.js -d "/var/log/*.txt"                    # supports glob patterns
sudo node index.js -d "/var/log/**/*.txt"                 # *.txt in any subfolder
sudo node index.js -d "/var/log/**/myapp.log"             # myapp.log in any subfolder
sudo node index.js -d "/var/log/+(name1|name2).log"       # supports extended glob patterns
sudo node index.js -e /var/log/nginx/error.log            # exclude specific files from -d
sudo node index.js -f /usr/local/nginx/logs/access.log    # add specific files
sudo node index.js -t production                          # tags
sudo node index.js -t production,app1=/opt/app1           # tags for specific paths
sudo node index.js -w System                              # Windows System event logs (all providers)

# other commands
sudo node index.js -l                                     # show all saved options from config
sudo node index.js -l tags,key,logdir                     # show specific entries from config
sudo node index.js -u tags                                # unset tags
sudo node index.js -u tags,logdir                         # unset tags and logdir
sudo node index.js -u all                                 # unset everything except ingestion key

# start the agent
sudo node index.js
Note that when using glob patterns with index.js, you must enclose the pattern in double quotes.
Configuration File
Normally a config file is automatically generated (e.g. when you set a key using index.js -k) and updated (e.g. when you add a directory using index.js -d) but you can create your own config file /etc/logdna.conf on Linux and C:\ProgramData\logdna\logdna.conf on Windows and save your settings there:
logdir = /var/log/myapp,/path/to/2nd/dir
key = <YOUR LOGDNA INGESTION KEY>
On Windows, use \\ as a separator:
logdir = C:\\Users\\username\\AppData\\myapp
key = <YOUR LOGDNA INGESTION KEY>
Configuration File Options
logdir: sets the paths that the agent will monitor for new files. Multiple paths can be specified, separated by,. Supports glob patterns + specific files. By default this option is set to monitor.logand extensionless files under/var/log/.exclude: sets files to exclude that would otherwise match what’s set inlogdir. Multiple paths can be specified, separated by,. Supports glob patterns + specific filesexclude_regex: filters out any log lines matching this pattern in any file. Should not include leading or trailing/.key: your LogDNA Ingestion Key. You can obtain one by creating an account at LogDNA. Once logged in, click on the Gear icon, then Account Profile to find your key.tags: tags can be used e.g. to separate data from production, staging, or autoscaling use caseshostname: set this to override the os hostnameautoupdate: whether the agent should update itself when new versions are available on the public repo (default is1, set to0to disable)winevent: sets Windows Event Log Configurations inlognameformat
Features
- The Agent maintains persistent connections to LogDNA ingestion servers with HTTPS encryption
- Reconnects if disconnected and will queue up new log lines while disconnected
- Compresses on upload (gzip)
- Rescans for new files in all
logdirpaths every minute - Handles log rotated files on most operating systems (supports: renamed, truncated & “new file per day” log rotation methods)
- Init script is available here (rpm/deb packages already include this)
- The Agent self-updates to latest point releases. There is no need to maintain the latest versions (this requires that the LogDNA YUM/APT repo be installed)
# YUM Repo
echo "[logdna]
name=LogDNA packages
baseurl=https://repo.logdna.com/el6/
enabled=1
gpgcheck=1
gpgkey=https://repo.logdna.com/logdna.gpg" | sudo tee /etc/yum.repos.d/logdna.repo

# APT Repo
echo "deb https://repo.logdna.com stable main" | sudo tee /etc/apt/sources.list.d/logdna.list
wget -O- https://repo.logdna.com/logdna.gpg | sudo apt-key add -
sudo apt-get update
How it Works
The LogDNA agent authenticates using your LogDNA Ingestion Key and opens a secure web socket to LogDNA’s ingestion servers. It then ‘tails’ for new log data, as well as watches for new files added to your specific logging directories.
If you don’t have a LogDNA account, you can create one on https://logdna.com. Or if you’re using macOS w/Homebrew installed:
brew cask install logdna-cli
logdna register <email>
# now paste the Ingestion Key into the kubectl commands above
Kubernetes Logging
Set up Kubernetes logging with with the LogDNA Agent using just 2 kubectl commands. We extract pertinent Kubernetes metadata including the pod name, container name, container id, namespace, and labels:
kubectl create secret generic logdna-agent-key --from-literal=logdna-agent-key=<YOUR LOGDNA INGESTION KEY>
kubectl create -f https://raw.githubusercontent.com/logdna/logdna-agent/master/logdna-agent-ds.yaml
This automatically installs a logdna-agent pod into each node in your cluster and ships stdout/stderr from all containers, both application logs and node logs. Note: by default, the agent pod will collect logs from all namespaces on each node, including kube-system. View your logs at https://app.logdna.com. See YAML file for additional options such as LOGDNA_TAGS.
Upgrading to LogDNA Agent 2.0 for Kubernetes
LogDNA recently made the LogDNA Agent 2.0 publicly available for Kubernetes users. We’ll be rolling this out to existing users as well as other platforms and operating systems over the next few weeks, but if you’d like to upgrade your existing Kubernetes agent you can simply run the following:
kubectl patch ds/logdna-agent -p '{"spec":{"updateStrategy":{"type":"RollingUpdate", "maxUnavailable":"100%"}}}'

kubectl patch ds/logdna-agent -p '{"spec":{"template":{"spec":{"containers":[{"name":"logdna-agent","image":"logdna/logdna-agent-v2:stable", "imagePullPolicy": "Always"}]}}}}'
To confirm that it upgraded correctly, please run kubectl get ds logdna-agent -o yaml | grep "image: logdna/". If you see image: logdna/logdna-agent-v2:stable then you are good to go.
If you’d like to to install LogDNA’s Agent 2.0 into a new cluster, you can simply run the following two kubectl commands:
kubectl create secret generic logdna-agent-key --from-literal=logdna-agent-key=<YOUR LOGDNA INGESTION KEY>

kubectl create -f https://raw.githubusercontent.com/logdna/logdna-agent/master/logdna-agent-v2.yaml
If you don’t have a LogDNA account, you can create one at https://logdna.com or if you’re on macOS w/Homebrew installed:
brew cask install logdna-cli
logdna register <email>
# now paste the Ingestion Key into the kubectl commands above
LogDNA created this integration mainly based on customer feedback and that logging with Kubernetes should not be this painful.
OpenShift Logging
OpenShift logging requires a few additional steps over Kubernetes, but still pretty easy! Like Kubernetes, LogDNA extracts pertinent metadata: pod name, container name, container id, namespace, project, and labels etc:
oc adm new-project --node-selector='' logdna-agent
oc project logdna-agent
oc create serviceaccount logdna-agent
oc adm policy add-scc-to-user privileged system:serviceaccount:logdna-agent:logdna-agent
oc create secret generic logdna-agent-key --from-literal=logdna-agent-key=<YOUR LOGDNA INGESTION KEY>
oc create -f https://raw.githubusercontent.com/logdna/logdna-agent/master/logdna-agent-ds-os.yml
This automatically installs a logdna-agent pod into each node in your cluster and ships stdout/stderr from all containers, both application logs and node logs. Note: By default, the agent pod will collect logs from all namespaces on each node, including kube-system. View your logs at https://app.logdna.com. See YAML file for additional options such as LOGDNA_TAGS.
Notes:
- The
oc adm new-projectmethod prevents having to adjust the project namespace’s node-selector after creation. - This uses
JOURNALD=files, you may need to change this if you have changed OpenShift logging configuration. - This has been tested on OpenShift 3.5-11